Technical analysis of 63 Moons Technologies Ltd (BSE: 526881) shows a strong breakout pattern. Key levels, targets, and support zones explained in simple terms.
Date: July 19, 2025
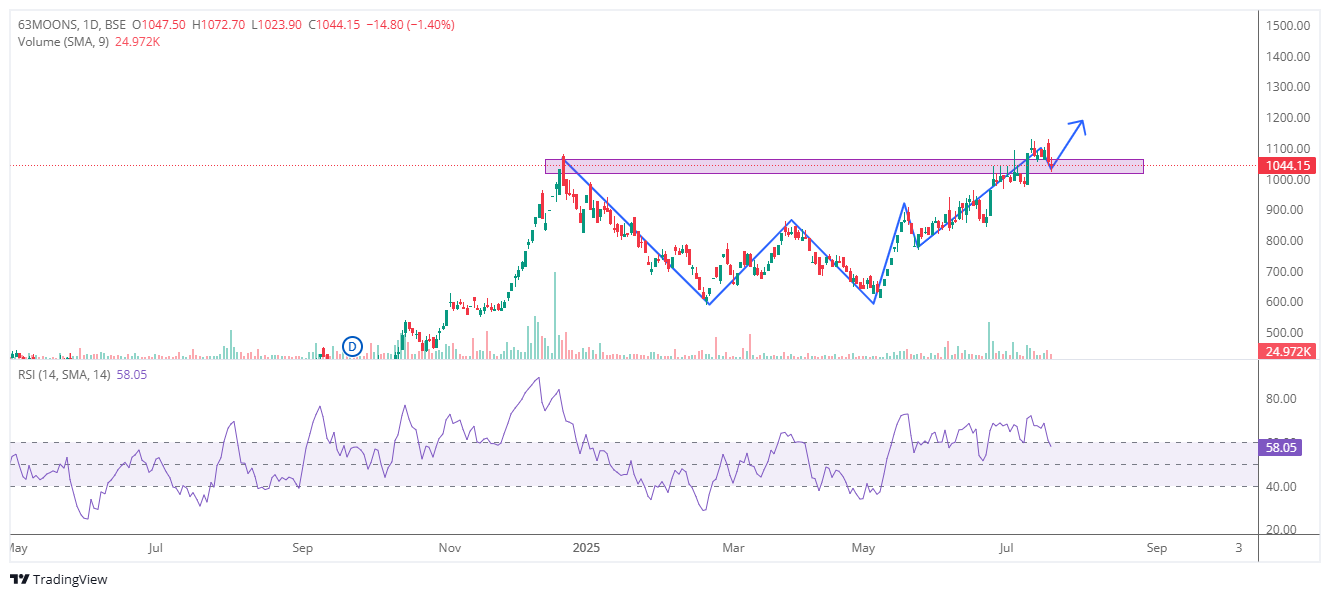
Current Price: ₹1,044.15
Sector: IT Services & Financial Technology
🔍 Overview
63 Moons Technologies has caught the market’s attention. While the stock fell 1.40% today, the bigger picture remains positive. The chart shows a clear uptrend. As a result, this could be a good time to watch the stock for a breakout move.
🧩 Chart Setup
Over the past few months, the stock has created a bullish pattern. This looks like a cup and handle or inverted head and shoulders formation. Both are strong signals of trend reversal.
Recently, 63 Moons broke above a key resistance zone at ₹1,030–₹1,070. That area had stopped price growth earlier. Now, it seems to be acting as a support.
After the breakout, the price pulled back slightly. However, this could just be a retest before the next move higher.
📊 Key Technical Indicators
| Indicator | Reading | What It Means |
|---|---|---|
| RSI (14) | 58 | Neutral – not overbought |
| Volume (SMA 9) | 24.9K | Steady – picked up on breakout |
| Support | ₹1,000–₹1,030 | Key demand zone |
| Resistance | ₹1,180–₹1,250 | Next possible targets |
| Trend | Higher highs & lows | Positive and strong |
The RSI is still under 60, meaning the stock is not in the overbought zone. This leaves room for more upward movement. Volume has also been steady, showing interest from traders.
🧭 What to Watch Next
The stock is testing the ₹1,030–₹1,050 area. If it holds, buyers could step in again. A bounce from this level could push the price toward ₹1,180 or even ₹1,250.
On the other hand, a fall below ₹1,000 may weaken this bullish setup. Therefore, risk control is important.
🧾 Why This Matters
There are several reasons this setup looks promising:
- The breakout has already happened
- The pullback is normal in strong uptrends
- RSI is healthy — not stretched
- Price is forming higher lows
- Volume supports the breakout
All these signs suggest the stock could move higher in the coming sessions.
📌 Conclusion
To sum it up, 63 Moons Technologies is showing a bullish chart with good momentum. The breakout is valid, and the price is now testing support. If this level holds, the stock may rally again.
✅ View: Bullish
📍 Buy Range: ₹1,030–₹1,050
🛡️ Stop Loss: ₹999 (daily close)
🎯 Target 1: ₹1,180
🎯 Target 2: ₹1,250+
⚠️ Disclaimer: This is not financial advice. Please consult a SEBI-registered advisor before investing.


Leave a reply
Your email address will not be published. Required fields are marked *