🎯 ASIANPAINT Technical Analysis: Resistance Rejects Rally Again
Stock: ASIANPAINT (NSE)
Current Price: ₹2,382.40
Chart Timeframe: 1 Day (Daily)
Date: July 20, 2025
📌 Overview
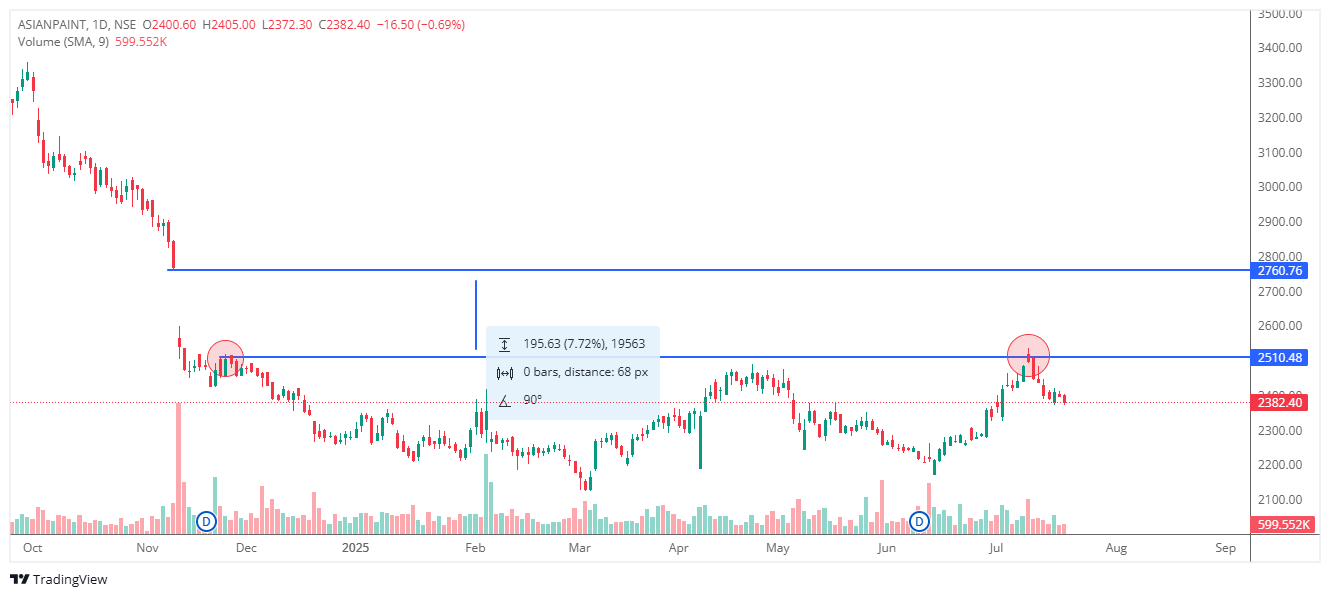
ASIANPAINT is showing signs of weakness after a strong rally stalled near a key resistance zone. Although the stock attempted a breakout, sellers stepped in quickly. As a result, the price reversed and is now consolidating below that level.
🔍 Key Levels to Watch
- Major Resistance: ₹2,510
- Immediate Support: ₹2,300
- Next Resistance (if breakout succeeds): ₹2,760
So far, the ₹2,510 level has acted as a strong supply zone. This is the second time price failed to cross this level, indicating that sellers continue to dominate near resistance.
📊 Price Structure Breakdown
Let’s look at the technical setup in detail:
- First Rejection
In late 2024, the price approached ₹2,510 but quickly reversed. This level acted as a strong ceiling. The downtrend continued for several months after that. - Base Formation and Recovery
From January to June 2025, the stock moved sideways. Buyers gradually took control, forming a base. Eventually, the price started to recover with stronger volumes. - Retest and Second Rejection
In early July, ASIANPAINT rallied once again to test ₹2,510. Although the breakout attempt looked strong, the price couldn’t hold above it. It reversed shortly after, marking a failed breakout. - Volume Confirmation
Interestingly, volume was elevated during both rally attempts. However, selling volume near resistance remains strong, which reinforces the bearish rejection.
📈 What This Means for Traders
Because the stock failed to break through ₹2,510 twice, this level becomes even more important going forward. If the price manages to sustain above ₹2,510, it could open the path toward the next resistance zone at ₹2,760.
On the other hand, if the stock breaks below ₹2,300, we may see a deeper pullback. Therefore, short-term sentiment will likely stay cautious unless a breakout occurs with high volume.
✅ Summary & Outlook
To summarize, ASIANPAINT has tested a critical resistance level twice but failed to break through. The price action now looks neutral to slightly bearish unless it reclaims the ₹2,510 mark. Traders should stay alert and watch for confirmation signals.
📉 View: Cautious / Neutral
🔺 Resistance: ₹2,510 and ₹2,760
🔻 Support: ₹2,300
🔍 Breakout Watch: Above ₹2,510 for fresh upside
⚠️ Disclaimer: This is for educational and informational purposes only. Please consult a SEBI-registered advisor before investing or trading.